Baltimore's Goal: 30% reduction in carbon emissions by 2025, a 60% reduction by 2030, and full carbon neutrality - or 100% reduction in net emissions by 2045 (relative to 2007)
Download the 2012 Climate Action Plan
Review and comment on the 2023 Climate Action Plan Update between October 1 and October 31, 2023. Click here to learn more and submit your comments.
Summary
When humans burn fossil fuels—such as coal, gasoline, and natural gas—we emit “greenhouse gases,” which are so-called because they change the makeup of the earth’s atmosphere to trap more heat (as a greenhouse does). These emissions are increasing the average temperature of the globe, contributing to rising sea levels, and changing our very climate. These changes are happening now, and in the future are expected to create even greater risks such as flooding, storm surges and wildfires, as well as disrupt food production, impact supply chains, and displace populations. Importantly, these risks will fall hardest on people who are more economically insecure, and on communities of color. For the health of the planet and human population, every city and jurisdiction has a responsibility to limit its contribution to greenhouse gas emissions.
The 2019 Sustainability Plan updated the greenhouse gas reduction goal in our 2012 Climate Action Plan. Baltimore now commits to achieving reductions similar to goals set by the Paris agreement: 25 percent reduction by 2020 and 30 percent by 2025 (relative to 2007). Our most recent inventory showed that emissions have dropped, but more work still needs to be done to ensure that all residents are able to breathe cleaner air and face reduced risks of natural disasters. About 70 percent of our city’s greenhouse emissions come from the use of energy that powers our homes and our commercial and industrial buildings. Transportation (such as driving cars) makes up 30 percent of our emissions, while waste disposal and water make up about one percent each.
Climate Action Plan Update
We have started the process of updating the 2012 Climate Action Plan (CAP Update), with a focus on integrating equity and resilience lenses. The CAP Update will strengthen the planning and policy connections between climate, flooding, adaptation, and resiliency in Baltimore and evaluate new and ambitious greenhouse gas (GHG) emissions reduction targets. We are currently developing a deep community engagement process to educate and elevate the visions of traditionally underrepresented residents of Baltimore City so the new Plan can be as relevant, actionable, and inclusive as possible. Visit the update page here.
Baltimore 2017 Greenhouse Gas Inventory
2017 Baltimore GHG Emissions Inventory Report
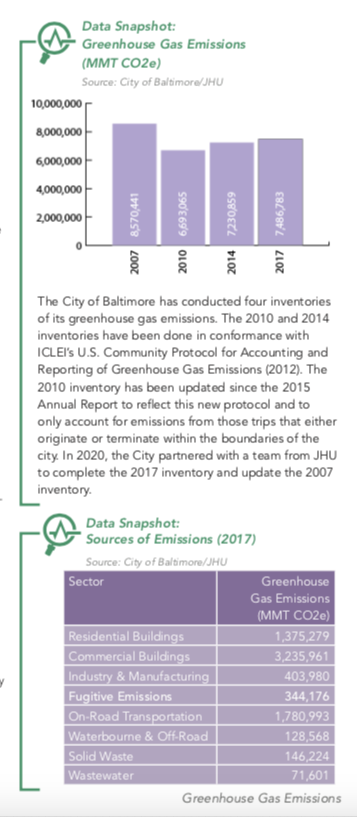
In 2017, Baltimore was responsible for the emission of 7,487,000 metric tons carbon dioxide equivalent (CO2eq). Emissions are dominated by Scope 1 and Scope 2 emissions from the stationary energy sector, which contribute 72% of the total, while 25% are from transportation within Baltimore and 3% of emissions are generated by waste management. In comparison to the 2007 baseline (8,570,000 tons CO2eq), emissions have been reduced by 13%, shy of our target of a 25% reduction by 2020 (relative to 2007). This result was driven by:
• A decrease in residential natural gas consumption (24%), possibly due to population loss and other demographic changes
• A decrease in electricity emissions (24-32%) due to the decrease in the use of coal power and an increase in the use of natural gas to generate electricity for the regional grid
• An increase in emissions from industrial and commercial gas consumption (50%), increase in transportation emissions by 8% and fugitive natural gas emissions (13%).
The protocols used to prepare the 2007 and 2017 inventories include some new emissions sources and methodologies that differ from those of the 2010 and 2014 inventories. The new sources include fugitive gas emissions and residential fuel oil, and a new methodology was used to estimate emissions associated with solid waste. These changes mean the new 2007 and 2017 inventories cannot be directly compared to the 2010 and 2014 inventories.
To avoid double-counting and to make sure that inventories are comparable across cities, the protocols that cities use to estimate their inventory exclude emissions from any source that produces power. For Baltimore, this includes the incinerator plus several other sources. These sources are estimated but not included in the totals above.


